Barometric Pressure Shifts and Scoring Patterns in Endurance Competitions
Written by Zoe Lang · Jul 12, 2026
Barometric Pressure Shifts and Scoring Patterns in Endurance Competitions
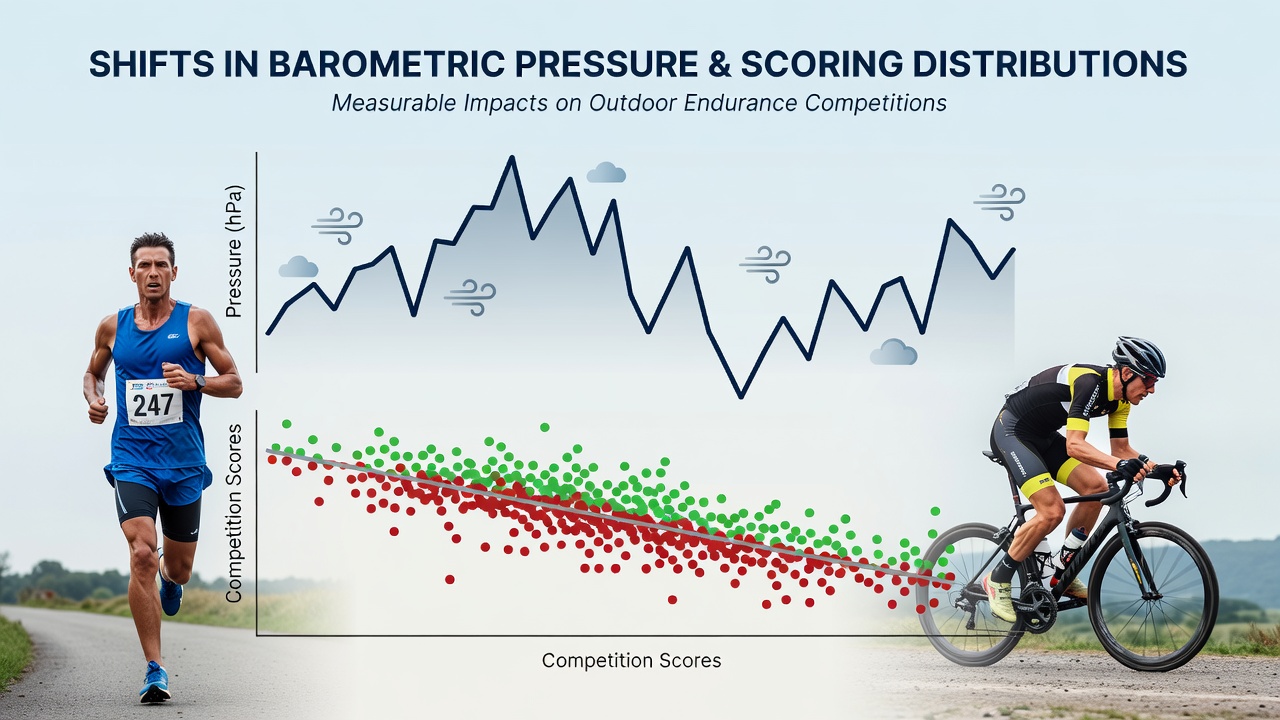
Barometric pressure changes create measurable shifts in how athletes perform during outdoor endurance competitions, and researchers track these effects through detailed performance records from races held across varying weather conditions. Lower pressure often correlates with reduced oxygen availability at elevation or during incoming weather systems, which in turn influences pacing strategies and final times across marathons, triathlons, and long-distance cycling events. Data collected from multiple seasons shows that scoring distributions tighten or spread depending on the magnitude and speed of these pressure swings.
Physiological Mechanisms Behind Pressure Effects
Athletes experience direct impacts when barometric pressure drops because partial pressure of oxygen decreases, forcing the body to work harder to maintain the same power output. Studies from sports physiology labs indicate that heart rate rises and perceived effort increases even when actual workload stays constant. These adjustments appear most clearly in events lasting longer than two hours where cumulative fatigue compounds the initial oxygen deficit. Observers note that competitors often adjust their effort earlier in races when forecasts predict falling pressure, leading to more conservative early splits and altered overall distributions at the finish.
Data Patterns From Recent Events
Performance records from competitions held through 2025 and into July 2026 reveal consistent trends. Events staged during periods of rapid pressure decline produced wider spreads in finishing times, with fewer athletes clustering around median scores and more outliers at both ends of the distribution. In contrast, stable high-pressure days produced tighter groupings where top performers maintained closer margins. Analysts examining these datasets point to the role of humidity and temperature interactions with pressure, yet pressure alone accounts for a measurable portion of variance in results according to regression models applied to race data.
Case Examples From Specific Disciplines
Marathon fields in high-elevation locations demonstrate pronounced effects when pressure dips further during the race window. Runners who start under falling readings post slower times overall, and the percentage of athletes achieving personal bests declines compared with stable conditions. Triathlon data shows similar patterns in the cycling and running legs, where cumulative oxygen demand amplifies small initial disadvantages. Cycling stage races provide additional granularity because teams can monitor pressure trends in real time and adjust tactics accordingly. Those who've reviewed split data from multiple Grand Tours find that mountain stages coinciding with low-pressure systems yield greater time gaps between contenders than equivalent stages under steady readings.
Measurement Approaches and Statistical Findings
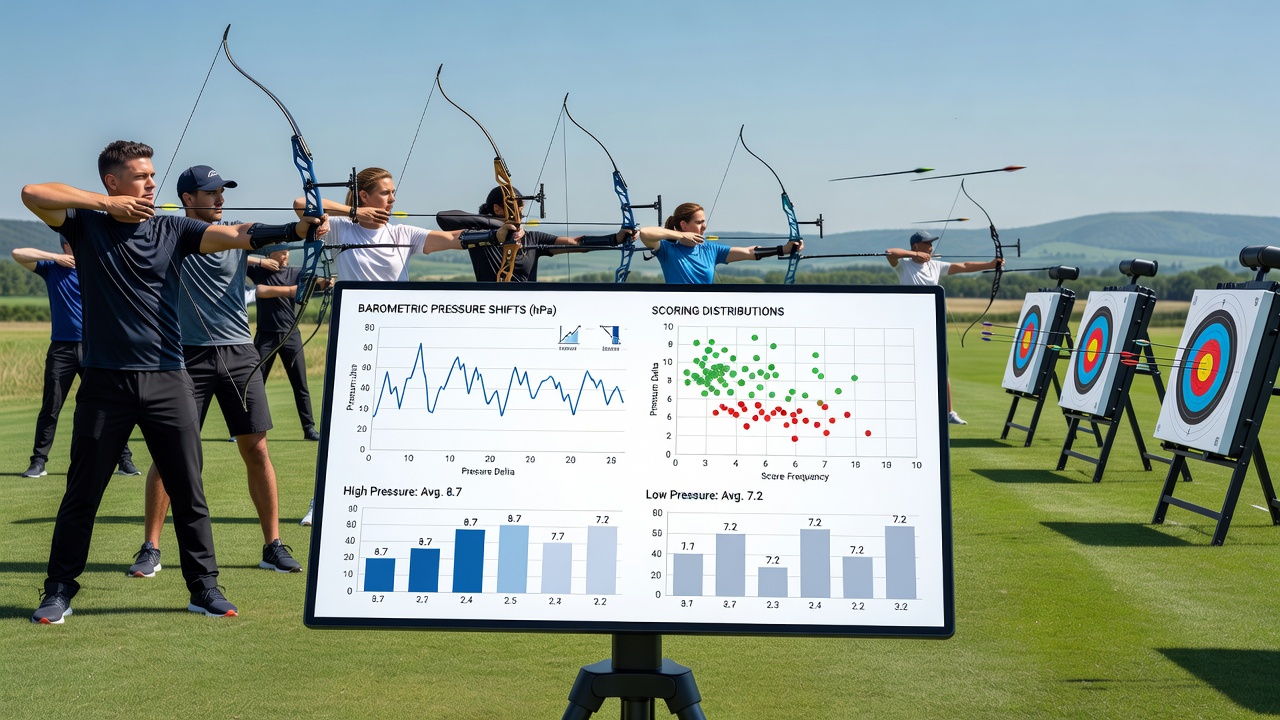
Researchers compile barometric readings from official weather stations near race courses and pair them with timing chip data to quantify relationships. Models built on these paired datasets consistently show statistically significant correlations between pressure change rates and scoring spread. One analysis covering several European and North American events found that a drop of five hectopascals over four hours widened the interquartile range of finishing times by approximately three percent. Such figures emerge after controlling for temperature, wind, and course profile variables. Academic teams continue refining these models by incorporating athlete acclimatization status and pre-race hydration metrics.
Additional work from institutions in Australia and Canada highlights regional differences. Courses at moderate elevations show amplified sensitivity because baseline oxygen levels already sit lower than at sea level. Data from those regions indicates that pressure shifts of the same magnitude produce larger effects than equivalent changes near coastal venues. These geographic variations help explain why organizers in different areas apply distinct weather adjustment protocols when publishing official results or seeding future fields.
Integration With Competition Planning
Event directors and timing officials now incorporate pressure forecasts into pre-race briefings more routinely. While rules rarely adjust scoring directly for weather, the recorded distributions feed into ranking algorithms and qualification standards. Sports governing bodies reference these environmental datasets when setting entry criteria for subsequent seasons. Teams and individual athletes likewise review historical pressure-performance pairings to refine training and race-day strategies. The result appears in more nuanced pacing plans that account for expected pressure trajectories rather than treating all race days as equivalent.
Conclusion
Barometric pressure shifts produce documented changes in scoring distributions across outdoor endurance competitions, and continued data collection refines understanding of the precise mechanisms involved. Records from events through mid-2026 underscore the value of integrating meteorological variables into performance analysis. As measurement tools improve and datasets grow, clearer patterns emerge that support better preparation across the sport.