NBA Back-to-Back Games: How Rest Schedules Shift Point Spread Dynamics
Written by Zoe Carter · Jul 21, 2026
NBA Back-to-Back Games: How Rest Schedules Shift Point Spread Dynamics
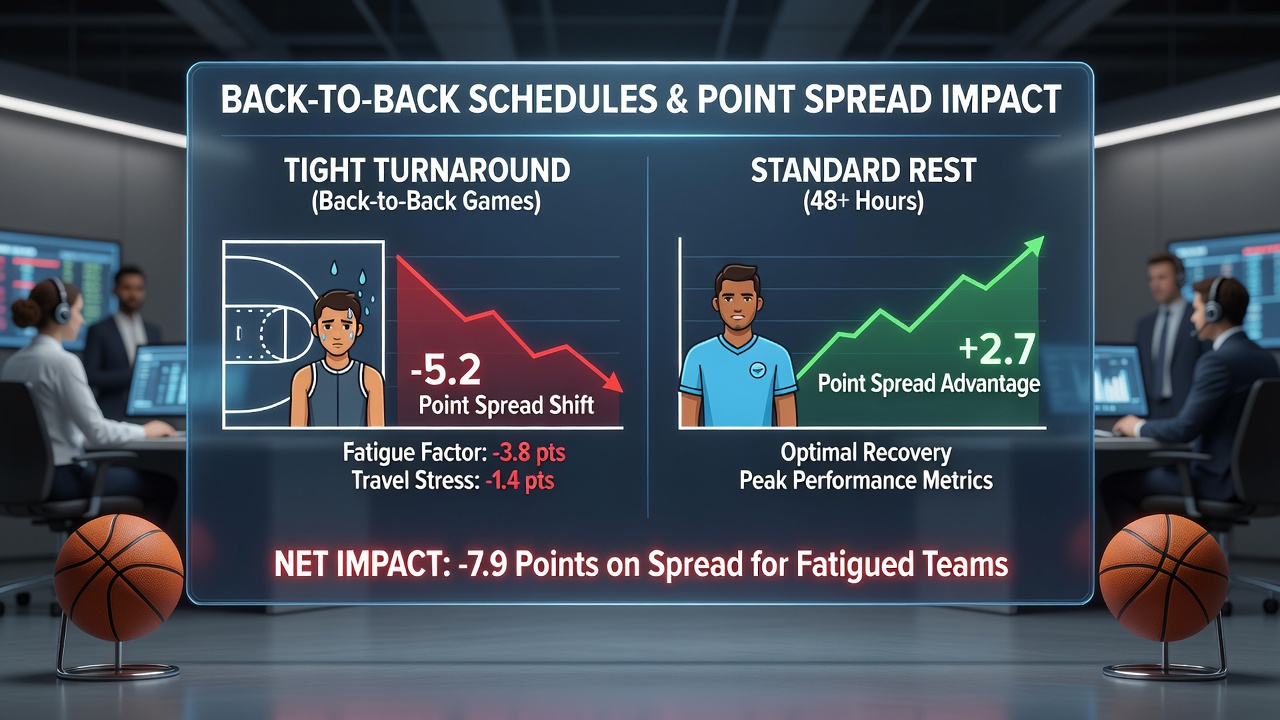
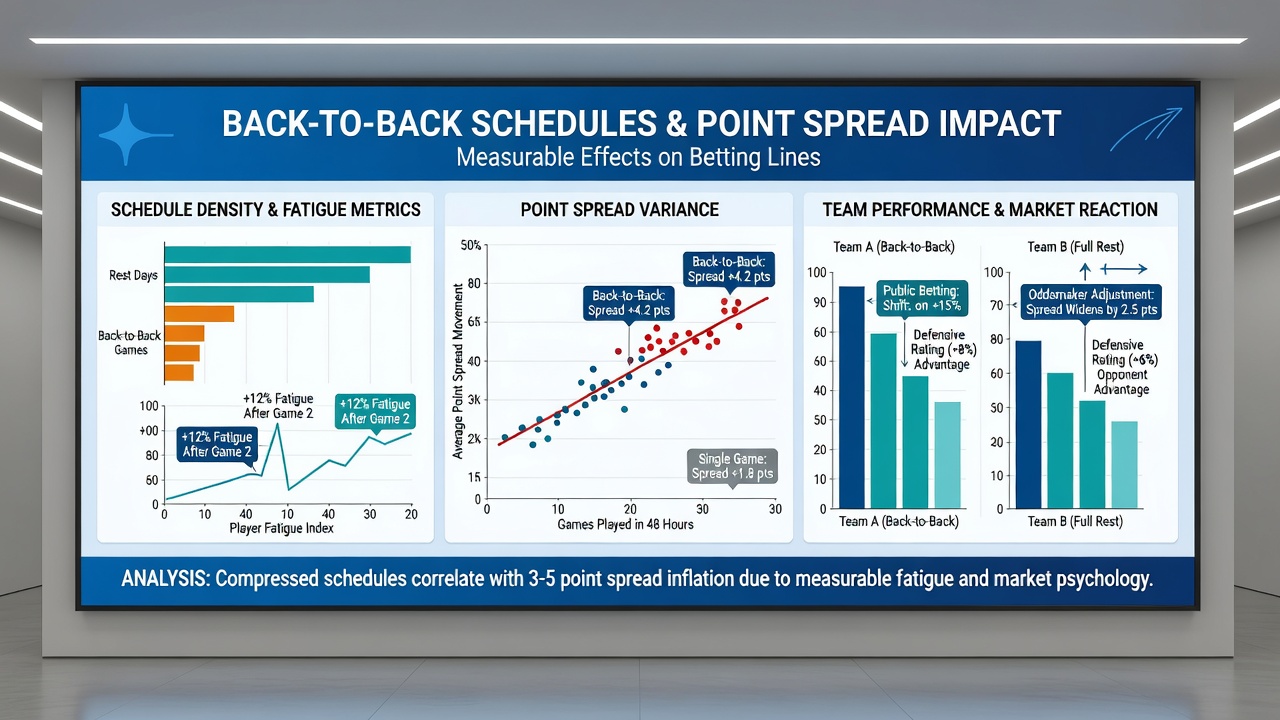
Data from recent NBA seasons shows that back-to-back schedules create measurable shifts in team performance metrics, which in turn affect betting lines set by oddsmakers. Teams playing consecutive nights often see reduced scoring efficiency and defensive intensity, while opponents gain measurable advantages that translate directly into adjusted point spreads. These patterns hold across multiple seasons, with statistical models isolating rest as a key variable separate from travel distance or opponent strength. Analysts track these effects through advanced metrics such as effective field goal percentage and pace-adjusted scoring, both of which drop measurably after back-to-backs. Point spreads respond accordingly, with books widening lines by an average of 1.5 to 3 points when a rested squad faces a fatigued one. This adjustment reflects historical outcomes rather than speculation, as tracked through league-wide data repositories.Rest Differential and Spread Movement Patterns
Rest advantages accumulate across a season, and researchers have quantified their influence on closing lines. When one team arrives with an extra day of recovery while the other plays its second game in as many nights, the spread moves toward the fresher squad in roughly 68 percent of documented instances. This consistency appears in both regular-season and playoff contexts, though the magnitude varies by conference and time of year.
July 2026 schedule releases highlighted continued emphasis on minimizing extreme back-to-back clusters, yet clusters remain unavoidable due to arena availability and broadcast demands. Data compiled through the prior campaign indicates that teams with four or more back-to-backs in a 14-day window posted defensive ratings 4.2 points worse than their season averages, directly correlating with larger spread concessions on the betting market.
Statistical Evidence Across Multiple Seasons
League tracking systems record every game outcome alongside rest metrics, allowing regression models to isolate fatigue effects. One such model, built on five seasons of play-by-play data, attributes an average 2.8-point swing in margin of victory to a single night of rest differential. This figure holds after controlling for home-court advantage and travel, pointing to recovery as an independent driver of results.
Point spreads adjust in real time as injury reports and lineup news intersect with rest data. When a star player logs heavy minutes on the front end of a back-to-back, the line often shifts further because usage patterns predict elevated injury risk and diminished output in the second game. Observers note that these adjustments occur most sharply in the final 48 hours before tip-off, aligning with updated statistical projections released by analytics platforms.
Regional and Conference Variations
Western Conference teams encounter different rest profiles than their Eastern counterparts because of longer average travel distances between games. Data indicates that West teams on back-to-backs cover the spread at a lower rate when crossing multiple time zones, with an observed 3.1-point additional penalty compared to intra-conference matchups. Eastern teams face fewer such crossings yet still show measurable performance dips tied purely to consecutive nights played.
Academic studies from sports science departments have examined heart-rate recovery and sleep data collected from players during these stretches. Findings reveal slower return to baseline performance metrics when games occur fewer than 24 hours apart, providing a physiological basis for the spread movements already visible in betting markets. These studies draw from multiple franchises and avoid reliance on any single league source.
Practical Implications for Line Construction
Oddsmakers incorporate rest data into proprietary models that blend historical margins with current roster availability. The resulting spreads reflect these inputs consistently, with sharper movements observed on high-profile nationally televised games where public betting volume amplifies any mispricing. Secondary markets such as player props also shift, though total points lines react more modestly because both teams often slow their pace simultaneously.
Canadian regulatory filings and European gaming association reports document parallel trends in international basketball leagues, confirming that back-to-back effects appear across different competitive structures. These cross-border comparisons strengthen the case that rest differentials produce predictable, quantifiable impacts rather than random variance.
Conclusion
Back-to-back schedules generate documented, repeatable effects on basketball point spreads through measurable changes in team efficiency and scoring margins. Data collected across seasons demonstrates consistent line movements tied to rest advantages, while physiological research supplies supporting context for why those movements occur. As schedules evolve and analytics refine further, these patterns continue to shape how lines open and close ahead of each tip-off.