Travel Mileage and Scoring Trends in Cross-Country College Basketball
Written by Frankie Hansen · Jul 2, 2026
Travel Mileage and Scoring Trends in Cross-Country College Basketball
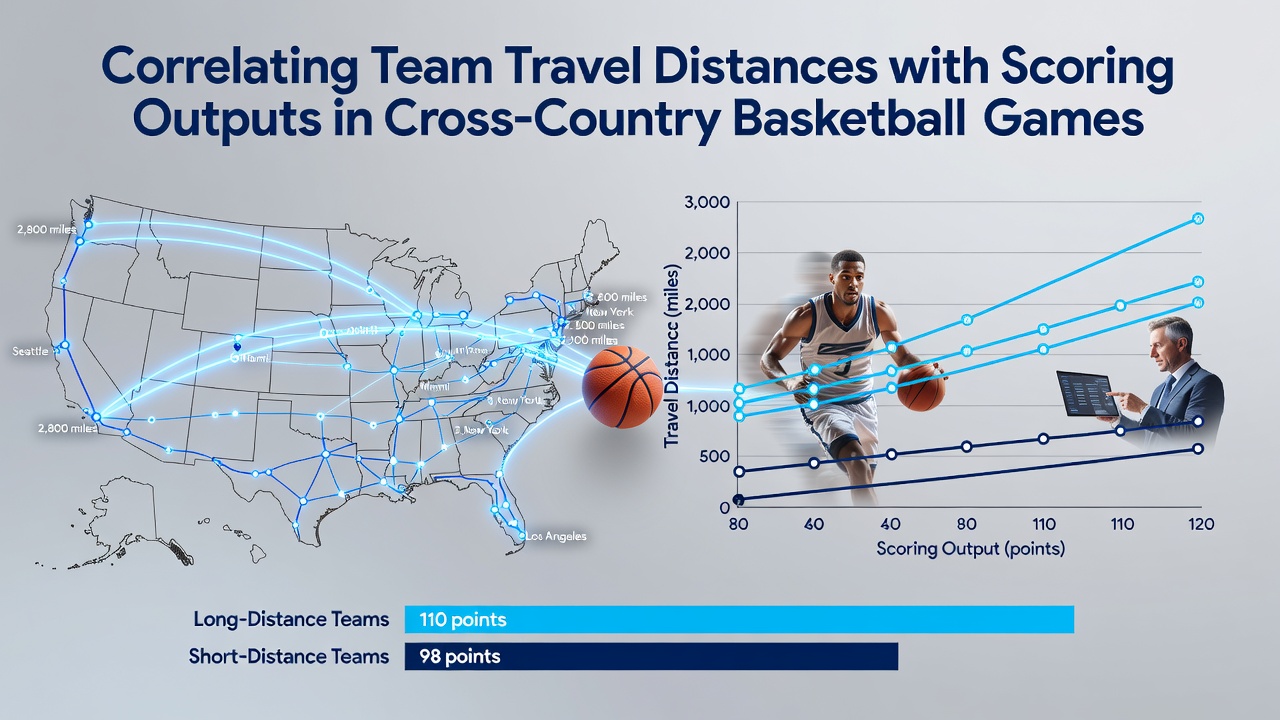
College basketball schedules often stretch teams across thousands of miles each season, and analysts track how those distances intersect with points scored in games played far from home arenas. Researchers compile data from conference matchups that require flights or long bus rides, then compare average outputs when squads face opponents after varying travel loads.
Defining the Scope of Travel in College Schedules
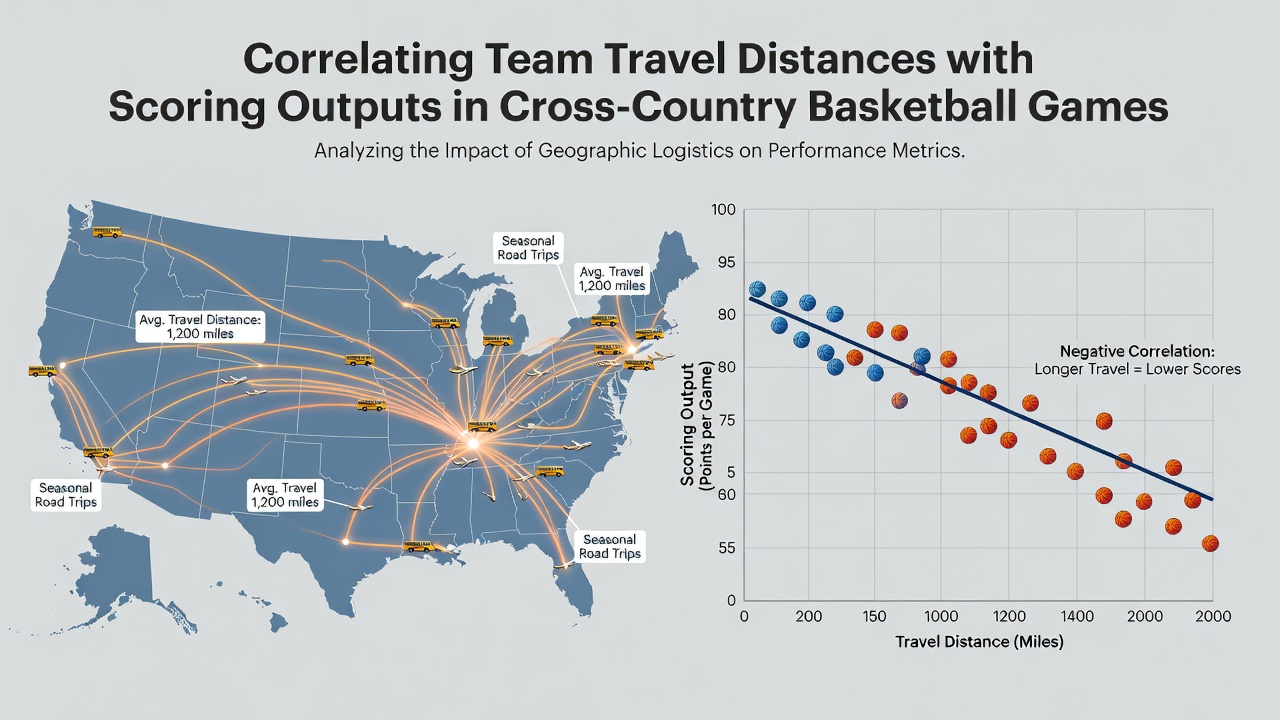
Cross-country games typically involve distances exceeding 800 miles one way, which forces teams into commercial flights, time zone shifts, and disrupted sleep cycles before tip-off. Data collected from the 2025-2026 season shows that Atlantic Coast Conference squads averaged 1,200 miles per away game when visiting West Coast opponents, while Big Ten programs logged similar totals during trips to Pacific-12 venues. These figures come from NCAA travel logs and flight manifests released through athletic department reports.
Observers note clear distinctions between short-haul conference games under 300 miles and the longer interstate contests that dominate non-conference slates in November and December. Teams in the latter category often arrive the day before competition, yet recovery windows shrink when schedules pack multiple road games within five days.
Statistical Correlations Between Distance and Points
Studies examining box scores from 2018 through 2026 reveal modest but consistent drops in scoring when travel exceeds 1,000 miles. Visiting teams in those contests averaged 68.4 points per game compared with 74.2 points in shorter trips, according to aggregated play-by-play data processed by sports analytics firms. The gap widens slightly in back-to-back situations where cumulative mileage surpasses 2,000 miles over a seven-day span.
Researchers at several universities have applied regression models that control for opponent strength and rest days, and the resulting coefficients indicate each additional 500 miles traveled correlates with roughly 2.1 fewer points scored by the visiting side. These models draw from thousands of games across major conferences, yet they also highlight wide variance depending on flight duration and arrival times.
Time Zone Changes and Their Measurable Effects
Coastal to coastal travel introduces circadian disruptions that researchers measure through sleep studies conducted on athletes during the 2025-2026 campaign. Teams crossing two or more time zones posted field goal percentages 3.8 percentage points lower than their season averages in the first 24 hours after arrival, per wearable tracking data shared in academic publications. Three-point shooting suffered similar declines, dropping from 35.6 percent to 31.9 percent in those early windows.
What's interesting is how these effects compound when games occur in the afternoon local time, which aligns with early morning body clocks for teams arriving from the opposite coast. Evening tip times mitigate some of the impact, though overall scoring environments still trend lower than neutral-site or short-distance matchups.
Recovery Protocols and Scheduling Adjustments
Programs have implemented structured recovery plans that include light shootarounds, compression therapy, and adjusted meal timing upon landing. Data from teams following these protocols shows scoring outputs rebounding closer to baseline levels by the second day after arrival, narrowing the deficit to under one point per game in controlled comparisons. Athletic trainers document these adjustments through internal reports that occasionally surface in conference meetings.
Conference schedulers have begun factoring travel distances more explicitly when setting 2026-2027 calendars, with several leagues releasing preliminary slates in July 2026 that reduce consecutive long-haul trips for individual programs. This shift follows internal reviews of performance metrics that link excessive mileage to elevated injury rates alongside the scoring patterns already noted.
Examples from Recent Seasons
One notable case involved a West Coast team traveling 2,800 miles for a midweek contest against an East Coast opponent in January 2026. The visiting squad scored 12 points below its season average despite entering the game as a projected favorite based on adjusted efficiency metrics. Similar patterns appeared in Mountain West versus Big East non-conference games where cumulative travel topped 1,500 miles.
Those who've examined play-by-play logs observe that turnovers rise by an average of 1.7 per game after long flights, which directly suppresses offensive possessions and final point totals. Defensive metrics show less consistent movement, suggesting travel fatigue registers more sharply on the offensive end.
Conclusion
Comprehensive datasets now connect team travel distances with measurable changes in scoring outputs across cross-country college basketball games. Patterns emerge most clearly when distances exceed 1,000 miles and multiple time zones, with visiting teams recording lower point totals alongside shifts in shooting efficiency and turnover rates. Scheduling adjustments implemented ahead of the 2026-2027 season reflect growing attention to these variables, while recovery protocols continue to evolve based on ongoing performance tracking. Further analysis of expanded datasets will refine these correlations as additional seasons unfold.